How to Plot a Unit Step Function in Matlab

Introduction to Matlab Unit Step Function
MATLAB unit step function is used to enable representation of a signal or pulse without the need to specify separate functional forms for various ranges of time. The unit step function is used to test the low and high-frequency response of any system in a single attempt. The unit step function takes theoretically zero time to change from 0 to 1. The unit step function is commonly called a Heaviside function.
Syntax:
H = Heaviside (t)
Details of unit step or Heaviside function:
- H = heaviside (t) is used to evaluate the unit step function value at 't'
- It is discontinuous in nature and returns following values:
- 0 if t < 0
- 1/2 if t = 0
- 1 if t > 0
Let us now understand how to use a Heaviside function or unit step function in MATLAB. We will discuss the code to do the following:
- The use of the Heaviside function
- Plotting a Heaviside function
Please note that we will use a symbolic object as the input in the below examples. However, if we use a floating-point input, we will get a floating-point output. Since the output for t < 0 and t > 0 will be an integer, it will not make a difference. We can see the difference when input is t = 0 (refer to Example 3).
Examples of Matlab Unit Step Function
Let us discuss some examples of Matlab Unit Step Function:
Example #1
In this example, we will use the unit step function for input less than 1 and will see the output.
Code:
H = heaviside (sym (-10))
[Initializing the symbolic object and passing a negative number as an argument]
This is how our input and output will look like in MATLAB:
Input:
![]()
Output:
![]()
As we can see, we have obtained 0 as the output for an argument which is a negative number, i.e. when 't' is less than 0.
Example #2
In this example, we will use the unit step function for an input greater than zero.
Code:
H = heaviside (sym (20))
[Initializing the symbolic object and passing a positive number as an argument]
This is how our input and output will look like in MATLAB:
Input:
![]()
Output:
![]()
As we can see, we have obtained 1 as the output for an argument that is a positive number, i.e. when 't' is greater than 0.
Example #3
This example will use the unit step function for an input greater than equal to zero. Here, we will discuss 2 scenarios:
- Using a symbolic object
- Not using a symbolic object (Using a floating-point input)
Code when using a symbolic object:
A = heaviside (sym (0))
[Initializing the symbolic object and passing zero as an argument]
This is how our input and output will look like in MATLAB:
Input:
![]()
Output:

As we can see, we have obtained 1/2 as the output for an argument equal to zero.
Code without using a symbolic object (Using floating-point input):
H = heaviside (0)
[Passing zero as an argument to 'heaviside' function]
This is how our input and output will look like in MATLAB:
Input:
![]()
Output:
![]()
As we can see, we have obtained a floating-point when we have not used a symbolic object in the input.
Next, we will learn to plot the unit step function in MATLAB.
Example #4
In this example, we will plot the unit step function for values between 0 and 5. As we know, the unit step function gives 0.5 as output for t = 0 and 1 for t > 0, so for the values between 0 and 5, the output will be starting from 0.5 (for t = 0), and then it will be 1 for all the values above 0.
Code;
syms t
[Initializing the symbolic object]
fplot (heaviside (t), [0, 5])
[Using 'fplot' function to plot the 'heaviside' function with values between 0 and 5]
This is how our input and output will look like in MATLAB:
Input:
![]()
Output:
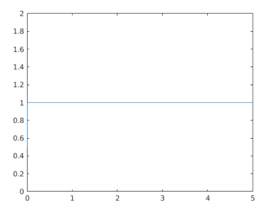
As we can see in the output, for the values between 0 and 5, the output is starting from 0.5 (for t = 0), and then it is 1 for all the values above 0.
Example #5
In this example, we will plot the unit step function for values between -5 and 5. As we know, the unit step function gives 0 as output for t < 0, 1 for t > 0 and 0.5 for t = 0, so for the values between -5 and 5, the output will be starting from 0 (for t < 0) and then it will be 0.5 for t = 0 and finally 1 for all the values above 0.
Code:
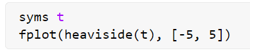
syms t
[Initializing the symbolic object]
fplot (heaviside (t), [-5, 5])
[Using 'fplot' function to plot the 'heaviside' function with values between -5 and 5]
This is how our input and output will look like in MATLAB:
Input:
Output:
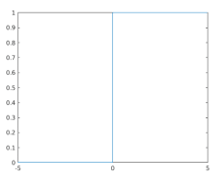
As we can see in the output, for the values between -5 and 0, the output is 0, and then there is a unit step from 0 to 1 when the input values are in the range of 0 to 5
Conclusion
The unit step function changes from 0 to 1 in almost no time. It can take three values: 0, 1, and ½. It is commonly used to test the low and high-frequency response of any system in a single attempt.
Recommended Articles
This is a guide to Matlab Unit Step Function. Here we discuss the Introduction, syntax, and examples. You may also have a look at the following articles to learn more –
- Nyquist Matlab
- Matlab limit
- Matlab Saveas
- Matlab Cell
How to Plot a Unit Step Function in Matlab
Source: https://www.educba.com/matlab-unit-step-function/
0 Response to "How to Plot a Unit Step Function in Matlab"
Post a Comment